Tariff intelligence
Structured fixed, energy-transfer and power charges, including measurement windows, peak logic and applicable customer segments.
 Request demo access
Peak Energy brings grid tariffs, invoices and site data into one consistent platform — helping multi-site operators make better pricing, investment and operational decisions.
Peak connects tariff rules, invoices and measured consumption so commercial, energy and operations teams can work from one consistent cost picture.
Structured fixed, energy-transfer and power charges, including measurement windows, peak logic and applicable customer segments.
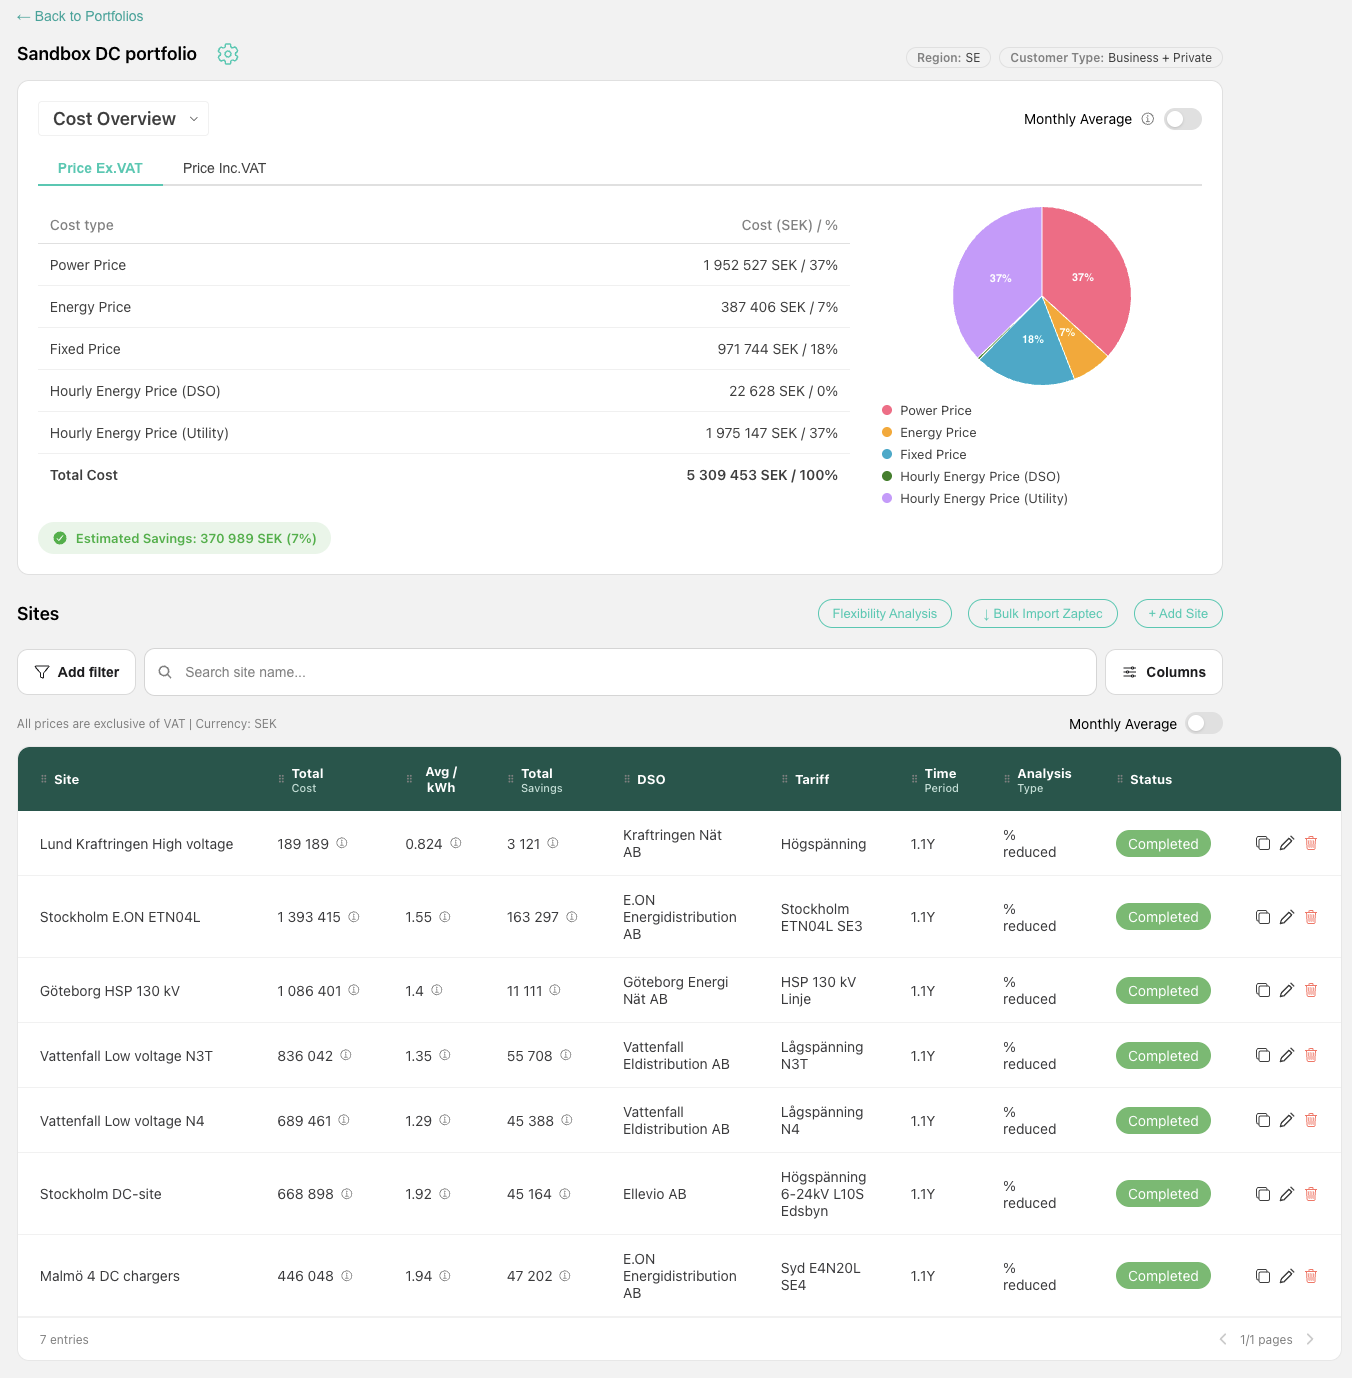
Calculate the complete electricity cost per kWh and see which sites, tariffs and peaks drive portfolio costs.
Test charging and capacity scenarios before changing operations. Results remain traceable to the applicable tariff and site data.
Peak standardises fragmented grid tariffs into a traceable data layer across 13 markets. Full coverage currently includes the Nordics, Benelux, the United Kingdom and Poland.
Explore detailed coverage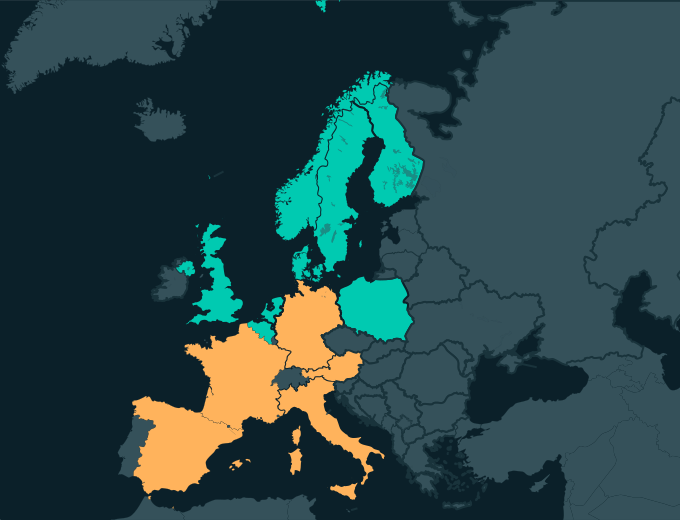
Coverage availability can differ by DSO and tariff segment.
Peak connects site data with the applicable tariff logic and turns the result into a consistent view across the portfolio.
Provide site addresses, tariff information and load or charging data through an export, file or supported connection.
We match sites to grid areas, apply the relevant tariff logic and calculate cost drivers.
Compare sites, understand cost per kWh and evaluate operational or commercial actions.
Upload invoices, build company portfolios, compare measured costs with billed amounts and investigate the peak and kWh events behind each result.
See which components drive the bill, compare sites on a consistent basis and focus attention where it can have the greatest effect.
Peak turns fragmented tariffs, invoices and consumption data into decisions for operators, flexibility providers and building-energy platforms.
Understand site economics, explain customer costs and identify operational actions.
Explore CPO use case →Assess sites, estimate available capacity and avoid creating new tariff costs while activating flexibility.
Explore Aggregator use case →Connect building load, invoices and local tariff logic for better control, budgeting and reporting.
Explore EMS use case →Tell us which grid areas and use cases matter to your portfolio. We’ll explain what can be analysed with the data you already have.